Strength in Motion: Decoding the Story Behind Rolling Alpha

Think about your favorite music band. One hit song might shoot them to fame, but to know if they’re truly legendary, you look at how their albums perform over time. Now, imagine a tennis player or a football team: a single victory can electrify fans, but true greatness is shown through consistent wins across seasons and tournaments.
That’s exactly what alpha and rolling alpha measure in the world of investing: not just the occasional hit, but whether a company can consistently outperform the market across multiple cycles.
Alpha: The Extra Edge
Alpha is the portion of a company’s return that cannot be explained by overall market movements (the benchmark) and risk factors—it’s the “excess return” that reflects company‑specific performance.
- If the market (the benchmark) delivered 10% and a company delivered 15%, its alpha is +5%.
- If the company managed only 7%, its alpha is ‑3%.
In simple terms: alpha shows whether a company is outperforming or underperforming the market once you strip out the market’s own effect.
Rolling Alpha: The Track Record
One box‑office hit doesn’t prove consistency. Likewise, one period of alpha doesn’t tell us much. Rolling alpha looks at performance over moving time windows (say, every 6 quarters), creating a trendline of consistency. It tells us whether the company is:
- a consistent over‑achiever,
- prone to cycles of boom and bust, or
- simply riding market waves.
NVIDIA’s Rolling Alpha (2015–2025): A Decade‑Long Plotline
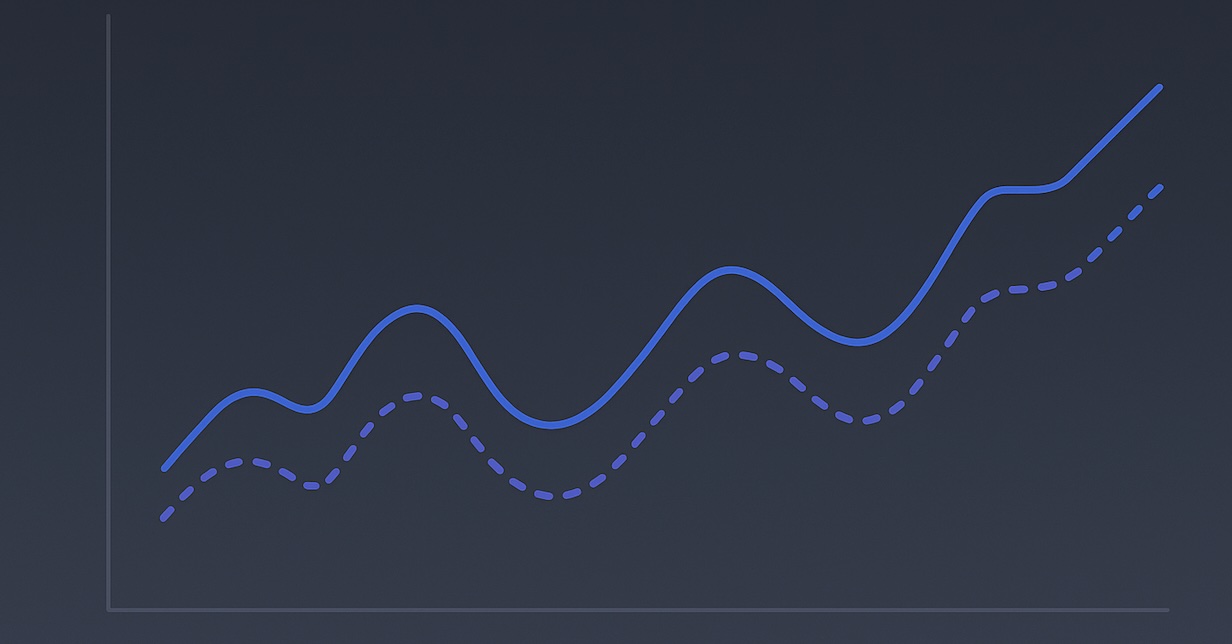
Now let’s treat the chart as a story, with NVIDIA as our protagonist and its competitors—Apple, Microsoft, and Google—as the cast of rivals. Each twist in NVIDIA’s 6‑quarter rolling alpha marks a new chapter:
Rolling alpha storyline reveals how strategy, market cycles, and external shocks shape long‑term value. The chart shows:
- Microsoft comes across as the steady and reliable climber.
- Apple demonstrates stability with predictable, consistent returns.
- Google appears in bursts of energy, impressive but less steady.
- NVIDIA delivers dramatic highs and lows, stealing the spotlight with its volatility.
Making Sense of NVIDIA’s Rolling alpha
Correlating events with NVIDIA’s dramatic highs and lows of rolling alphs over the last 10 years?
| Period ▲▼ | Chapter Title | Narrative |
|---|---|---|
| 2015–2016 | The Setup — GPUs Meet AI | NVIDIA shifts from being “just a graphics company” to an AI compute powerhouse. Pascal GPUs win gamers, datacenter GPUs start powering deep learning, leading to early alpha gains. |
| 2017–2018 | The First Surge — Crypto + AI Tailwinds | A crypto-mining frenzy and rising AI demand push GPU sales, sending alpha soaring above market levels. |
| 2018–2019 | The Plot Twist — The Crypto Hangover | Crypto collapse and weak gaming demand cause inventory pileups. NVIDIA issues profit warnings, alpha plunges. |
| 2019–2020 | Rebuilding — Networking + Pandemic Demand | Pandemic gaming boom and Ampere GPU launches help alpha rebound. |
| 2023 | The Second Surge — Generative AI Supercycle | ChatGPT ignites global AI race. NVIDIA’s H100 chips dominate, and guidance shocks Wall Street. Alpha spikes. |
| 2024 | Deepseek moment | The rise of DeepSeek’s efficient AI models shakes investor confidence in NVIDIA’s dominance. Questions emerge on whether NVIDIA’s hardware-driven advantage can withstand software-led disruption, creating sudden market pressure and sparking debate on the sustainability of its AI moat. |
For investors and observers alike, rolling alpha teaches a simple lesson: short‑term spikes make headlines, but consistent positive alpha writes history.
(Optional Read) Technical Deep Dive of Alpha (α)
Alpha is a measure of excess return — how much a portfolio or stock outperforms (or underperforms) its benchmark after adjusting for risk.
The general formula:
\[\alpha = R_p - \left[ R_f + \beta \times (R_m - R_f) \right]\]Where:
- $R_p$ = Portfolio (or stock) return
- $R_f$ = Risk-free rate (e.g., Treasury yield)
- $R_m$ = Market benchmark return
- $\beta$ = Sensitivity of the portfolio to the market (systematic risk)
Interpretation:
- $\alpha > 0$: Outperformed the market after accounting for risk.
- $\alpha < 0$: Underperformed.
Rolling Alpha (6-Month Example)
Imagine you are evaluating a portfolio’s performance against the S\&P 500. Instead of looking at the entire 3-year history at once, you calculate alpha in 6-month chunks.
- Pick the window: 6 months.
-
First window (Jan–Jun 2022):
- You regress the portfolio’s returns against the S\&P 500.
- The regression gives an alpha of +1.2% → the fund outperformed.
-
Next window (Feb–Jul 2022):
- Slide the window forward by one month.
- Now the alpha is +0.5% → still positive, but weaker.
-
Next window (Mar–Aug 2022):
- Market volatility hits, regression shows alpha –0.8% → the fund underperformed.
- Keep repeating:** Each 6-month rolling regression gives a new alpha number.
A time series of alphas: (+1.2%, +0.5%, –0.8%, …) shows where the fund consistently added value and where it struggled.